Architecting an AI-Native SEO Analysis Engine

All books
Chapter 1

Architecting an AI-Native SEO Analysis Engine

We shipped Guka’s Farm Network, a farm management platform for Kenyan farm managers, and the launch was quiet.

Two weeks post-launch, the Umami analytics dashboard was flat. Near-zero organic traffic. We had product-market fit (early adopters confirmed it), so the problem was upstream: visibility and discovery. SEO.

SEO is usually treated as a marketing checklist. Sprinkle meta tags, add alt text, submit a sitemap. But when your audience is Kenyan farm managers on feature phones over 3G, SEO is a system design challenge.

Umami analytics dashboard showing flat traffic post-launch

The Manual Audit Loop

My first approach was manual auditing: open DevTools, run Lighthouse, check HTML, compare against best practices, tweak JSX, rebuild, redeploy, repeat.

A single cycle:

  1. Run Lighthouse, note scores
  2. View source, check meta tags and heading hierarchy
  3. Compare against SEO checklist
  4. Make a change in the codebase
  5. Deploy to staging
  6. Run Lighthouse again
  7. Realize you broke something else
  8. Back to step 2

Each cycle took 15-20 minutes. After a full day, maybe 6 meaningful iterations.

The Idea

Build a tool that does what I was doing manually, but programmatically. Static analysis of rendered HTML, resource auditing, performance metrics, and structured analysis powered by an LLM that synthesizes everything into actionable recommendations.

What followed was a deeper engineering challenge than expected.

Chapter 2

The SPA Problem

The Naive Approach

First prototype: fetch HTML, parse DOM, extract signals.

const response = await fetch(url);
const html = await response.text();
const dom = parseHTML(html);
const title = dom.querySelector('title')?.textContent;

Works for static sites. But Guka’s Farm Network is a React SPA. Fetching it returns:

<body>
  <div id="root"></div>
  <script src="/static/js/bundle.js"></script>
</body>

An empty div. No content, no headings, no dynamically injected meta tags. From the analyzer’s perspective, a blank page.

Playwright

The fix: stop pretending to be an HTTP client and use a real browser. Playwright launches headless Chromium, navigates to the URL, waits for JavaScript to execute, then exposes the fully-rendered DOM.

import { chromium } from 'playwright-extra';
import StealthPlugin from 'puppeteer-extra-plugin-stealth';

chromium.use(StealthPlugin());

const browser = await chromium.launch({
  headless: true,
  args: ['--no-sandbox', '--disable-setuid-sandbox'],
});

const page = await context.newPage();
await page.goto(url, { waitUntil: 'domcontentloaded', timeout: 60000 });
await page.waitForTimeout(3000);

const signals = await page.evaluate(() => ({
  title: document.title,
  h1s: [...document.querySelectorAll('h1')].map((el) => el.textContent),
  metaDescription: document.querySelector('meta[name="description"]')?.content,
  schemaTypes: [...document.querySelectorAll('script[type="application/ld+json"]')]
    .map((el) => JSON.parse(el.textContent))
    .map((obj) => obj['@type']),
}));

The page.evaluate() call runs inside the browser context. React has hydrated, dynamic content has loaded, client-side meta tags have fired. We see exactly what a real user sees.

Signal Extraction

With the rendered DOM, the analyzer pulls 40+ signals per page:

CategorySignals
MetadataTitle, meta description, robots, canonical URL, language
HeadingsH1-H3 count and content
SocialOpen Graph, Twitter Card metadata
SchemaJSON-LD types (FAQPage, LocalBusiness, etc.)
ContentWord count, first 2000 chars
ImagesTotal count, missing/empty alt text
LinksInternal, external, broken anchors
TechnicalHTTPS, viewport meta, lazy loading, preconnect
E-E-A-TAuthor markup, phone numbers, FAQ schema
AccessibilitySkip links, heading hierarchy, alt coverage

SSRF Protection

Accepting arbitrary URLs and pointing a headless browser at them creates a serious SSRF vector. If someone submits http://169.254.169.254/latest/meta-data/ or http://localhost:3000/admin, the server navigates there and potentially leaks sensitive data.

Two-tier protection:

// Tier 1: Pre-navigation DNS check
async function assertSafePublicHttpUrl(raw: string): Promise<string> {
  const url = new URL(raw);
  const addresses = await dns.resolve(url.hostname);
  for (const addr of addresses) {
    if (isPrivateIP(addr)) {
      throw new Error('URL resolves to a private IP address');
    }
  }
}

// Tier 2: Runtime route interception
page.route('**/*', async (route) => {
  const requestUrl = route.request().url();
  if (!isSafePublicNetworkUrlSync(requestUrl)) {
    await route.abort('blockedbyclient');
    return;
  }
  await route.continue();
});

Tier 1 resolves DNS before launching the browser and rejects private IPs (RFC 1918, link-local, loopback). Tier 2 intercepts every network request at runtime, catching redirects from public URLs to internal ones.

SSRF protection two-tier validation flow

Chapter 3

The AI Analysis Layer

Beyond Checklists

Traditional SEO tools give you a score and a list of warnings. “Missing H1 tag.” “Meta description too long.” Surface-level observations that tell you what’s wrong but rarely synthesize the bigger picture.

I wanted something closer to what a senior SEO consultant would deliver: contextual reasoning about why issues matter and what the business impact is.

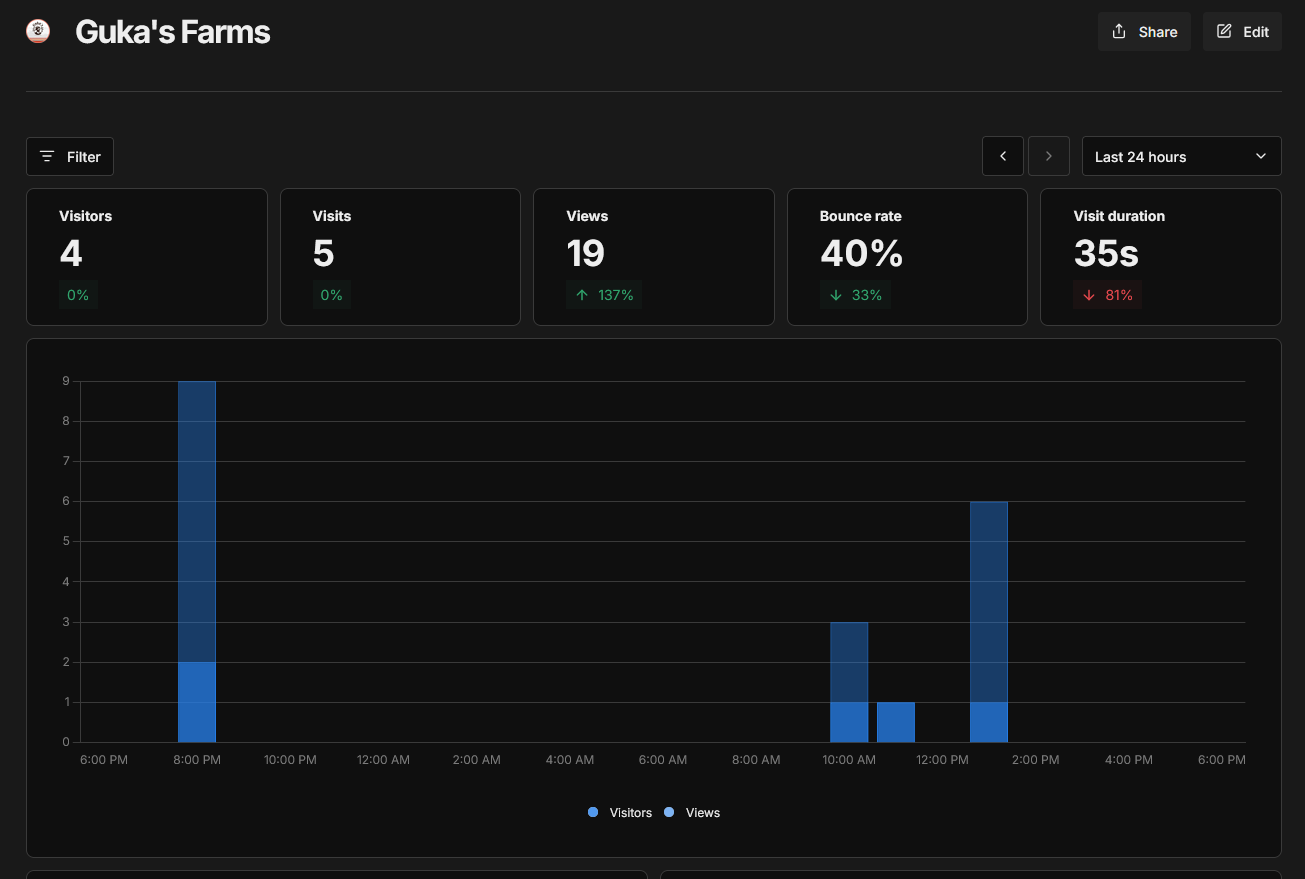
A missing Open Graph image is minor for a B2B enterprise site. But for a farm management platform where users discover tools through WhatsApp link sharing? That missing OG image is a critical discovery bottleneck, because WhatsApp renders link previews from OG tags, and a link with no preview gets ignored.

This kind of contextual reasoning is what LLMs are good at.

Structured Output with Zod

We use Gemini (gemini-3-flash-preview) via the Vercel AI SDK’s generateObject, which guarantees output conforms to a Zod schema. No freeform text, no fragile regex parsing. The model outputs a fully typed JavaScript object.

const analysisSchema = z.object({
  industry: z.string(),
  overallScore: z.number().min(0).max(100),
  scores: z.object({
    technicalSEO: z.number().min(0).max(100),
    onPageSEO: z.number().min(0).max(100),
    geoOptimization: z.number().min(0).max(100),
    aeoOptimization: z.number().min(0).max(100),
    eatSignals: z.number().min(0).max(100),
    socialPresence: z.number().min(0).max(100),
  }),
  grade: z.enum(['A', 'B', 'C', 'D', 'F']),
  summary: z.string(),
  monetaryImpact: z.object({
    estimatedMonthlyLoss: z.number(),
    lossBreakdown: z.array(
      z.object({
        category: z.string(),
        amount: z.number(),
        description: z.string(),
      })
    ),
    methodology: z.string(),
  }),
  criticalIssues: z.array(
    z.object({
      issue: z.string(),
      severity: z.enum(['critical', 'high', 'medium', 'low']),
      impact: z.string(),
      fix: z.string(),
    })
  ),
  recommendations: z.array(
    z.object({
      priority: z.number(),
      category: z.enum(['Technical SEO', 'On-Page SEO', 'GEO', 'AEO', 'E-E-A-T', 'Local SEO']),
      title: z.string(),
      description: z.string(),
      expectedImpact: z.string(),
      effort: z.enum(['low', 'medium', 'high']),
      timeframe: z.string(),
    })
  ),
  quickWins: z.array(
    z.object({
      action: z.string(),
      impact: z.string(),
    })
  ),
  competitiveInsights: z.string(),
});

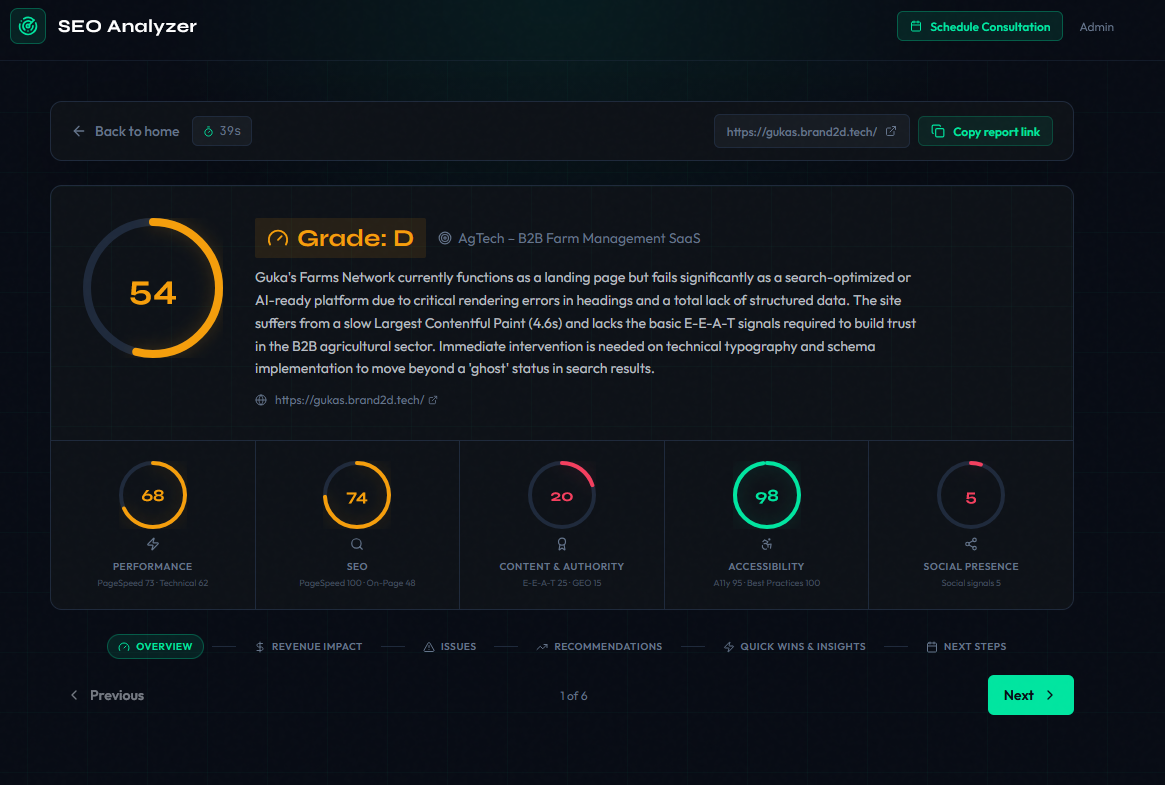
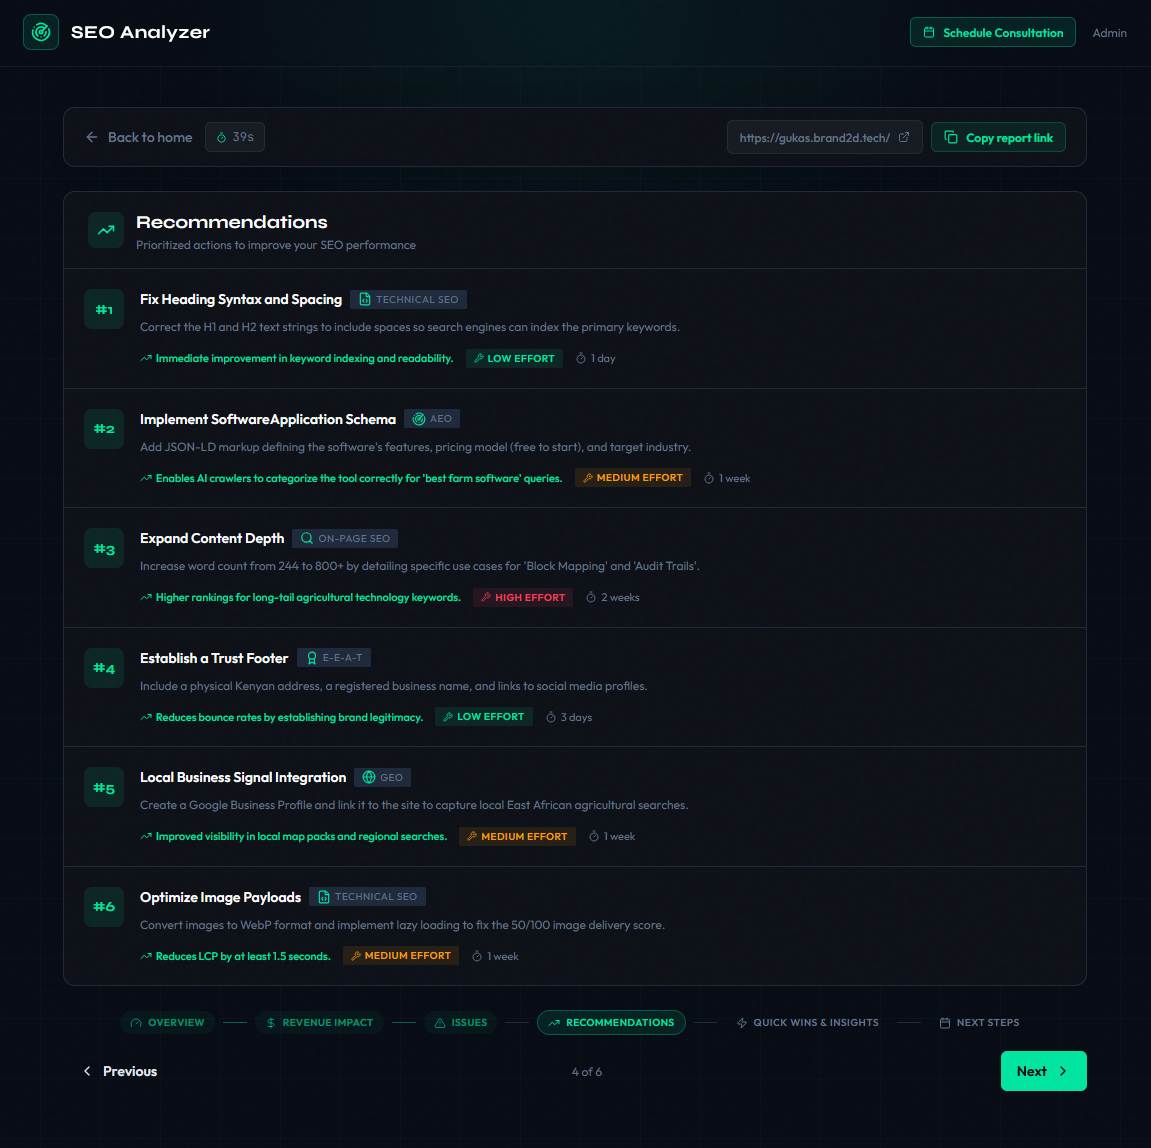
Six scoring dimensions. Monetary impact in KES (Kenyan shillings). Prioritized recommendations with effort estimates. Quick wins for non-technical stakeholders.

The Prompt

The prompt is where the real engineering happens. We construct a structured briefing that mirrors how a consultant would receive information:

const prompt = `You are a senior SEO/GEO/AEO consultant. Analyse this website
and produce a detailed performance report. Score STRICTLY on actual evidence.
All monetary estimates in KES.

URL: ${signals.finalUrl}

## PageSpeed (Google PSI)
Performance: ${scores.performance} Accessibility: ${scores.accessibility}
Best Practices: ${scores.bestPractices} SEO: ${scores.seo}

Scoring notes: Field INP > lab TBT as ground truth. Lighthouse mobile
uses 4x CPU throttle — do not over-penalise lab-only slowness when
visual metrics (LCP/CLS) are healthy.

## On-page signals (Playwright full render)
Title: "${signals.title}" (${signals.titleLength} chars)
H1(${signals.h1Count}): ${JSON.stringify(signals.h1s)}
Schema types: ${signals.schemaTypes.length ? signals.schemaTypes.join(', ') : 'NONE'}

## Content sample (first 2000 chars)
${signals.contentSample}

Deliver: 4-6 critical issues, 6-8 recommendations, 4 quick wins.`;

Key prompt choices:

  1. “Score STRICTLY on actual evidence” prevents hallucinated issues
  2. Lighthouse calibration notes stop the model from over-penalizing throttled mobile scores
  3. Content sample gives enough context to understand purpose and audience without blowing the context window
  4. Graceful degradation when PageSpeed data is unavailable, the prompt says “Do not treat this as a zero score”

The call:

const { object } = await generateObject({
  model: google('gemini-3-flash-preview'),
  schema: analysisSchema,
  prompt,
});

AI analysis pipeline: signals to prompt to Gemini to structured output

Chapter 4

The Performance Problem

The Missing Piece: Lighthouse

The scraper + Gemini pipeline gave us SEO insights but had a gap: performance analysis. Over 70% of web traffic is mobile. In Kenya, that number skews higher, and most target users are on feature phones with limited processing power over 3G. Core Web Vitals (LCP, INP, CLS) are direct Google ranking signals.

We needed Lighthouse metrics.

Version 1: Local Lighthouse

Running Lighthouse locally meant spinning up another Chromium instance, navigating to the page, and running the full audit suite.

MetricValue
Simple site analysis~5 minutes
Complex site analysis~10 minutes
Memory per analysis~300 MB
Lighthouse share of total time~80%
ReliabilityFlaky, frequent timeouts

300 MB per analysis. Two separate Chromium instances (scraper + Lighthouse) with different configurations, cleanup logic, and failure modes.

Version 2: Google PageSpeed API

Google provides Lighthouse analysis through their PageSpeed Insights API with generous free-tier limits. They run Lighthouse on their infrastructure.

import { pagespeedonline } from '@googleapis/pagespeedonline';

export async function runLighthouseAudit(url: string) {
  const client = pagespeedonline({ version: 'v5', auth: API_KEY });
  const res = await client.pagespeedapi.runpagespeed({
    url,
    strategy: 'mobile',
    category: ['performance', 'accessibility', 'best-practices', 'seo'],
  });
  const cats = res.data.lighthouseResult.categories;
  return {
    scores: {
      performance: cats.performance.score * 100,
      accessibility: cats.accessibility.score * 100,
      bestPractices: cats['best-practices'].score * 100,
      seo: cats.seo.score * 100,
    },
    report: res.data.lighthouseResult.audits,
  };
}
MetricLocalPageSpeed API
Lighthouse latency~4 min~1.5 min
Memory per analysis~300 MB~200 MB
Chromium instances21
ReliabilityFlakyGoogle’s problem
Code complexity~200 lines of orchestrationSingle API call

The Concurrency Breakthrough

After the migration, the pipeline looked like:

Scrape (90s) → PageSpeed (90s) → AI (60s) = ~240s

Steps 1 and 2 are independent. Neither depends on the other. They only converge at the AI stage. I was running them sequentially. The fix:

// Before: sequential
const signals = await scrapeWebsite(url);
const lighthouse = await runLighthouseAudit(url);

// After: concurrent
const [signals, lighthouse] = await Promise.all([
  scrapeWebsite(url, options),
  runLighthouseAudit(url),
]);

Results:

ComplexitySequentialConcurrentSpeedup
Simple~3 min~1 min3x
Complex~5 min~3 min~1.7x

Pipeline comparison: sequential vs concurrent execution

Full Optimization Journey

Optimization journey from V1 to V3

From 6.5 minutes to 2.5 minutes. A 62% reduction through two architectural changes: delegating Lighthouse to Google and parallelizing independent tasks.

Chapter 5

Perceived Performance

The 3-Minute Problem

After all optimizations, complex sites still took around 3 minutes. Diminishing returns on actual performance since the bottleneck was Gemini’s inference latency. Shaving off 10-20 seconds wouldn’t change perception.

Research consistently shows that users perceive apps as faster when they receive progress feedback, even when processing time is identical. Progress indicators can make waits feel up to 30% shorter.

I didn’t need to make the analysis faster. I needed to make it feel faster.

From Spinner to Stages

The initial implementation used a single loading spinner for the entire 3-minute analysis. Most users would assume the app crashed and close the tab.

The fix: a stage-based progress system with distinct, observable phases.

const STAGES = [
  { status: 'PENDING', label: 'Queued', description: 'Preparing analysis pipeline...' },
  { status: 'SCRAPING', label: 'Scanning', description: 'Scanning page & running Lighthouse...' },
  { status: 'ANALYZING', label: 'AI Analysis', description: 'Evaluating with AI...' },
  { status: 'COMPLETED', label: 'Done', description: 'Your analysis is ready!' },
];

The backend updates the record’s status as it progresses. The frontend polls every 2 seconds and renders the appropriate UI:

await db.analysis.update({
  where: { id: analysisId },
  data: { status: 'SCRAPING', stage: 'Scanning page...' },
});

const [signals, lighthouse] = await Promise.all([scrapeWebsite(url), runLighthouseAudit(url)]);

await db.analysis.update({
  where: { id: analysisId },
  data: { status: 'ANALYZING', stage: 'Running AI analysis...' },
});

Each transition is visible to the user. The progress bar advances, description updates, and a per-stage timer resets. Instead of “3m 22s” next to a spinner, you see “Scanning… 45s” then “AI Analysis… 28s”. Shorter, more tolerable increments.

The Radar

An animated radar visualization during the scanning phase communicates “active scanning.” It evokes systematic, thorough analysis rather than “is this broken?”

<motion.div
  className="absolute top-1/2 left-1/2 h-1/2 w-0.5 origin-top"
  animate={{ rotate: 360 }}
  transition={{ duration: 2, repeat: Infinity, ease: 'linear' }}
>
  <div className="h-full w-full bg-gradient-to-b from-[#00e5a0] to-transparent" />
</motion.div>

Small glowing dots appear on the radar as stages complete, providing additional visual feedback.

Scanning view with radar animation and stage progress

Result

The actual analysis time didn’t change. The experience did:

BeforeAfter
Single spinner3-stage progress bar
One timer counting to 3+ minutesPer-stage timers that reset
No feedback on what’s happeningDescriptive labels per stage
Static loading stateAnimated radar with completion dots
User thinks: “Is this broken?”User thinks: “This is thorough.”

Once you’ve exhausted your optimization budget, invest in progress communication. Users tolerate surprisingly long waits if they trust the system is working.

Chapter 6

System Architecture

The Stack

Full system architecture diagram

LayerTechnologyWhy
FrontendNext.js 15, React 19, TailwindCSS 4App Router, RSC, streaming
APItRPC 11End-to-end type safety, no codegen
DatabasePostgreSQL + Prisma 7JSON fields, strong typing
ScrapingPlaywright + Stealth PluginFull browser rendering
PerformanceGoogle PageSpeed Insights APIDelegated Lighthouse
AIGemini + Vercel AI SDKStructured output via Zod
AuthBetter AuthAdmin dashboard access
AnalyticsUmamiPrivacy-respecting, self-hosted

Fire-and-Forget

When a user submits a URL:

  1. Create a database record with status: PENDING
  2. Return the id immediately, redirect to /analysis/{id}
  3. Background processing starts asynchronously
  4. Frontend polls getStatus every 2 seconds until COMPLETED or FAILED
const record = await db.analysis.create({
  data: {
    url: normalizedUrl,
    status: 'PENDING',
    stage: 'Queued for analysis...',
  },
});

// Fire-and-forget
void processAnalysis(record.id, url, options);

return { id: record.id }; // Instant response

The user never sits on a loading mutation. They’re immediately navigated to the results page, which handles its own loading state with the radar animation.

Error Handling

Every external dependency can fail. The architecture degrades gracefully at each level:

  • Scraper timeout: “The page took too long to load.”
  • PageSpeed unavailable: Analysis continues without performance data. AI prompt says: “Do not treat this as a zero score.”
  • DNS failure: Caught before browser launch: “Could not reach the website.”
  • Rate limiting: Clear error with reset time.
function toUserFriendlyError(message: string): string {
  const lower = message.toLowerCase();
  if (lower.includes('timeout')) return 'The page took too long to load...';
  if (lower.includes('econnrefused') || lower.includes('enotfound'))
    return 'Could not reach the website...';
  if (lower.includes('ssl')) return 'The website has an SSL/certificate issue...';
  return 'Analysis failed unexpectedly. Please try again.';
}

Data Model

The analysis record stores everything as JSON in a single PostgreSQL row:

model Analysis {
  id              String   @id @default(cuid())
  url             String
  status          String   @default("PENDING")
  stage           String   @default("Queued for analysis...")

  overallScore    Int?
  grade           String?
  scores          Json?
  issues          Json?
  recommendations Json?
  quickWins       Json?
  monetaryImpact  Json?
  lighthouseData  Json?
  signals         Json?

  createdAt       DateTime @default(now())
  completedAt     DateTime?
  errorMessage    String?
}

An analysis is a snapshot, not an evolving entity. Normalizing scores, issues, and recommendations into separate tables would add query complexity with zero benefit. A single findUnique returns everything the frontend needs.

Production Hardening

  • Browser singleton with lifecycle hooks for SIGTERM/SIGINT cleanup. If it disconnects (OOM kill, crash), the reference nulls and the next request triggers a fresh launch.
  • Stealth plugin patches headless browser detection vectors (WebDriver flags, navigator.webdriver).
  • SSRF at two layers: pre-navigation DNS validation and runtime route interception.
  • Rate limiting: IP + User-Agent composite key. Admins bypass via Better Auth.
Chapter 7

Results

The Verdict

We built this tool because Guka’s Farm Network wasn’t getting organic traffic. Time to diagnose the patient.

Analysis results overview for Guka's Farm Network

The numbers weren’t great. But that’s the point: quantified evidence instead of vague “we should probably fix the SEO” conversations.

Issues detected across every dimension:

  • Missing Open Graph tags (critical for WhatsApp/social sharing in Kenya)
  • No schema markup (FAQPage, LocalBusiness)
  • Heading hierarchy violations
  • Missing meta descriptions
  • Mobile performance bottlenecks

More valuable than the diagnosis was the treatment plan. Recommendations prioritized by impact and effort:

Recommendations showing prioritized fixes

Each recommendation includes category, expected impact, effort level, and timeframe. The quick wins section covers actions completable in under 30 minutes: add a meta description, set an Open Graph image, add alt text to the hero image.

The Feedback Loop

The feedback loop: before and after

From 3 meaningful iterations per day to 15+. The tool doesn’t replace SEO expertise, but it compresses the feedback loop to the point where iterative improvement becomes practical.

Since implementing the high-priority recommendations, Guka’s Farm Network has seen measurable improvements in organic discovery. The trajectory changed from flat to upward.

Chapter 8

Reflections

Honest Assessment

This is a 3-day architecture. Not a SaaS platform with queuing infrastructure, worker pools, and horizontal scaling. The background processing runs in-process. Rate limiting is in-memory. The browser singleton means concurrent analyses share a Chromium process.

These are known limitations, acceptable for the current scale. Engineering is about solving the problem in front of you, not the one you might have in 12 months.

Scaling Roadmap

If this needed to handle hundreds of concurrent analyses:

  1. External task queue (BullMQ / Inngest) to decouple the pipeline from the web server
  2. Dedicated worker instances running Playwright on memory-optimized containers
  3. Result caching by URL + content hash to avoid re-analyzing unchanged pages
  4. Webhook/SSE instead of polling for status updates

None of that is needed today. The architecture is clean enough that any of these changes would be additive, not a rewrite.

What I’d Do Differently

Streaming results. Currently the entire analysis is computed and delivered as a monolithic JSON object. A better experience: stream partial results as they arrive. Show Lighthouse scores while AI analysis is still running. The Vercel AI SDK supports this; the constraint is frontend architecture.

Screenshot capture. Playwright can trivially capture page screenshots (page.screenshot()). Useful for stakeholders who want a visual reference alongside the analysis.

Historical tracking. Running the same URL multiple times should show a trend line. The data model supports this (each analysis is a separate record with a timestamp), but the UI doesn’t surface it yet.

From Internal Tool to Public

This was built as an internal utility to diagnose why Guka’s Farm Network wasn’t ranking. The team saw the demo, tried it on their own projects, and the reaction was unanimous: “This should be public.”

It’s live at seo.phidel.dev.

A headless browser for signal extraction. An LLM for contextual analysis. Concurrent orchestration for performance. Progressive feedback for UX. None of these are novel individually, but composed together, they solve a real problem.

All because a farm management platform wasn’t showing up on Google.